After my recent article (part , , ) about crime and police shootings in the United States and their connection to race, I decided to continue this topic and analyze other open data in the same vein - fortunately, there is still plenty of it thanks to the FBI's crime reporting program. Today we will examine data on crimes committed on the basis of intolerance. First, let's look at all the statistics as a whole, and then we will look in detail at racial intolerance and specifically crimes committed by whites and blacks based on hostility towards whites and blacks.
Disclaimer
Let me be lazy and send you, dear readers, to look at the disclaimer at the beginning of my first article about crime in the USA. Everything that is written there is also suitable for this study.
Initial data
As initial data, I downloaded the dataset from the Crime Data Explorer website, maintained by the FBI as part of the US Crime Reporting Program (I already wrote about this site in a previous article).
You can download it via direct link here (4.4 MB). The downloaded archive contains the data itself in CSV format, as well as a text description. I did not transform the data in any way, so if you want to repeat the analysis yourself, you should get the same results. I also used data on the US population by race, obtained from official data from the Census Bureau and supplemented by model data for the period from 1991 to 2009. You can download it here (Yandex.Disk). To analyze the geographic distribution of specific indicators, I also needed the population by state, obtained from the same source (download here). I used the same data in my previous article.
What are hate crimes and how are they recorded?
From the FBI website:
The FBI's UCR Program defines hate crime as a committed criminal offense which is motivated, in whole or in part, by the offender's bias(es) against a race, religion, disability, sexual orientation, ethnicity, gender, or gender identity.
Translation:
The FBI Crime Reporting Program defines a hate crime as a crime committed that is motivated (in part or in whole) by the offender's bias against race, religion, disability, sexual orientation, ethnic group, gender, or gender identity.
The certificate accompanying the original crime dataset also states the following (italics retained):
Because motivation is subjective, it is sometimes difficult to know with certainty whether a crime resulted from the offender's bias. Moreover, the presence of bias alone does not necessarily mean that a crime can be considered a hate crime. Only when a law enforcement investigation reveals sufficient evidence to lead a reasonable and prudent person to conclude that the offender's actions
were motivated, in whole or in part, by his or her bias, should an agency report an incident as a hate crime.
In other words, all cases registered in the database as crimes motivated by intolerance should be included there only after the motive for the criminal’s actions has been established by the investigation.
Naturally, it is impossible to verify the conclusions of the investigation in each case, since the database aggregates the reports of hundreds of different law enforcement agencies across the country and access to all investigation materials is (one can assume) only for FBI employees. The database itself provides only ready-made statistics.
Database structure
The database contains data on hate crimes from 1991 to 2022. At the time of writing, the latest entry dates back to December 31, 2022, with a total of 201,403 entries.
Each record is one crime incident. Thus, we get an average of 7193 crimes per year. List of database fields in original CSV format
- INCIDENT_ID: Event (crime) ID
- DATA_YEAR
: year in which the crime was committed - ORI: ID of the agency (law enforcement) that provided the data
- PUB_AGENCY_NAME: public name of the agency/service (usually the same as the city)
- PUB_AGENCY_UNIT: name of the service unit (for example, county)
- AGENCY_TYPE_NAME: service type (municipal/county)
- STATE_ABBR: State abbreviation
- STATE_NAME
: full state name - DIVISION_NAME: name of the region (which includes several states)
- REGION_NAME: name of the macroregion (which includes several regions)
- POPULATION_GROUP_CODE: crime location code by population
- POPULATION_GROUP_DESC: description of the crime location by population (for example, “a city with a population of 0.5 to 1 million”)
- INCIDENT_DATE: date of commission of the crime
- ADULT_VICTIM_COUNT: number of adult victims
- JUVENILE_VICTIM_COUNT: number of minor victims
- TOTAL_OFFENDER_COUNT: total number of offenders
- ADULT_OFFENDER_COUNT: number of adult offenders
- JUVENILE_OFFENDER_COUNT: number of juvenile offenders
- OFFENDER_RACE
: race/s of the offender(s) - OFFENDER_ETHNICITY: ethnic group of the offender(s) (Hispanic/non-Hispanic/Mixed/Unknown)
- VICTIM_COUNT: total number of victims (individuals and legal entities)
- OFFENSE_NAME
: type of crime committed - TOTAL_INDIVIDUAL_VICTIMS: total number of victims (individuals)
- LOCATION_NAME: crime scene (e.g. apartment, highway, school, etc.)
- BIAS_DESC
: type of intolerance (motive for crime) - VICTIM_TYPES
: category/s of victims (individuals / authorities / private company, etc.) - MULTIPLE_OFFENSE: multiple crime marker (i.e. if more than one type of crime was committed)
- MULTIPLE_BIAS: multiple motive marker (not one, but several types of intolerance)
In the study, I use only a few fields (those in
bold
) because my main goal is
to find connections between types of crimes, types of intolerance, and the race of the perpetrators
. However, in your own research you can, of course, go further and analyze, for example, the ages of the criminals and victims, or the typical locations of crimes depending on their types, etc. As they say, the scope of imagination is unlimited
Types of crimes
The database includes 13 main types of crimes:
- crimes against the person
: murder, rape, assault, felonious assault, personal threat and human trafficking (sexual slavery and slave labor) - property crimes
: robbery, trespassing, theft, theft, arson and property damage/vandalism
and also (in the expanded framework we will use) additional types of offenses such as drug trafficking, fraud and even more “exotic” ones in the context of intolerance, such as prostitution, incest or sodomy.
All 48 categories of crimes (names in original)
Aggravated Assault All Other Larceny Animal Cruelty Arson Assisting or Promoting Prostitution Betting/Wagering Bribery Burglary/Breaking & Entering Counterfeiting/Forgery Credit Card/Automated Teller Machine Fraud Destruction/Damage/Vandalism of Property Drug Equipment Violations Drug/Narcotic Violations Embezzlement Extortion/Blackmail False Pretenses/Swindle/Confidence Game Fondling Hacking/Computer Invasion Human Trafficking, Commercial Sex Acts Identity Theft Impersonation Incest Intimidation Kidnapping/Abduction Motor Vehicle Theft Murder and Nonnegligent Manslaughter Negligent Manslaughter Not Specified Pocket-picking Pornography/Obscene Material Prostitution Purchasing Prostitution Purse-snatching Rape Robbery Sexual Assault With An Object Shoplifting Simple Assault Sodomy Statutory Rape Stolen Property Offenses Theft From Building Theft From Coin-Operated Machine or Device Theft From Motor Vehicle Theft of Motor Vehicle Parts or Accessories Weapon Law Violations Welfare Fraud Wire Fraud
Types of intolerance / motives for crimes
In accordance with the definition above, the following types of intolerance are entered into the database:
- against race
(anti-white, anti-black, anti-Asian, anti-Jewish, etc.) - anti-ethnicity
(anti-Hispanic) - against a confession or religious worldview
(against Christians, against atheists, against Muslims, against Jehovah's Witnesses, etc.) - against sexual orientation or gender
(against male and female homosexuals, against men, against women, against transgender people, etc.) - against physical limitations
(hatred of disabled people)
Moreover, each crime can have up to 5 different types of intolerance as a motive. Therefore, when working with such multiple characteristics, we will have to enlarge the categories.
Categories of victims
The program records crimes both against individuals and against organizations, the state or even society as a whole, while highlighting the number of individuals affected.
We will only consider cases with injured people. So, armed with Python with pandas or a couple of other libraries (see the “Tools” section in my previous article), and also not forgetting to skip coffee, tea, beer or kombucha (whatever you like)… we pull the mask over our face, put on surgical gloves , adjusting the operating lamp and...
How homosexuals are extorted money
Meduza special correspondent Daniil Turovsky spoke in April 2016 about a group of criminals extorting money from homosexuals. Turovsky’s report featured an apartment at 224 Moskovsky Prospekt. Young people recalled how they were invited to this apartment on a date through the gay dating app Hornet.
Once on the spot, the victims were surrounded by people claiming that a meeting had been arranged with a minor. This was filmed, and the extortionists demanded money for not distributing it. Extortion was accompanied by beatings. In a similar episode, the attackers introduced themselves to the victim as “the public organization Dobrota.” A source close to the Main Directorate of the Ministry of Internal Affairs told Meduza that the group has been operating since 2015 and consists of approximately 20 people from 18 to 45 years old.
One of the young people who were extorted told Meduza that he filed a report with the police, but did not talk about the progress of the investigation. He also found ten more similar victims: according to him, only one of the people he interviewed decided to file a police report. According to Meduza, at the time of writing the report, materials were being collected and witnesses were being interviewed.
Dissecting the data
As in the previous article, I perform all the analysis in Jupyter Lab / Notebook on Python 3.8. Here I will not cite or comment on the code itself - you can download it from this link (there is a listing and a file in Jupyter Notebook format in the archive). Let's focus more on the results we get. All graphs are clickable
.
Data overview and top lists
After loading data from CSV (only the columns needed for research), we get the following dataframe:
| YEAR | STATE_NAME | OFFENDER_RACE | OFFENSE_NAME | BIAS_DESC | VICTIM_TYPES | |
| 0 | 1991 | Arkansas | White | Intimidation | Anti-Black or African American | Individual |
| 1 | 1991 | Arkansas | Black or African American | Simple Assault | Anti-White | Individual |
| 2 | 1991 | Arkansas | Black or African American | Aggravated Assault | Anti-Black or African American | Individual |
| 3 | 1991 | Arkansas | Black or African American | Aggravated Assault;Destruction/Damage/Vandalis… | Anti-White | Individual |
| 4 | 1991 | Arkansas | Black or African American | Aggravated Assault | Anti-White | Individual |
| … | … | … | … | … | … | … |
| 201398 | 2018 | West Virginia | NaN | Burglary/Breaking & Entering | Anti-Black or African American | Individual |
| 201399 | 2018 | West Virginia | White | Simple Assault | Anti-Black or African American | Individual |
| 201400 | 2018 | West Virginia | NaN | Intimidation | Anti-Asian | Individual |
| 201401 | 2018 | West Virginia | White | Intimidation | Anti-White | Law Enforcement Officer |
| 201402 | 2018 | West Virginia | NaN | Burglary/Breaking & Entering;Destruction/Damag… | Anti-Other Religion | Religious Organization |
201403 rows × 6 columns
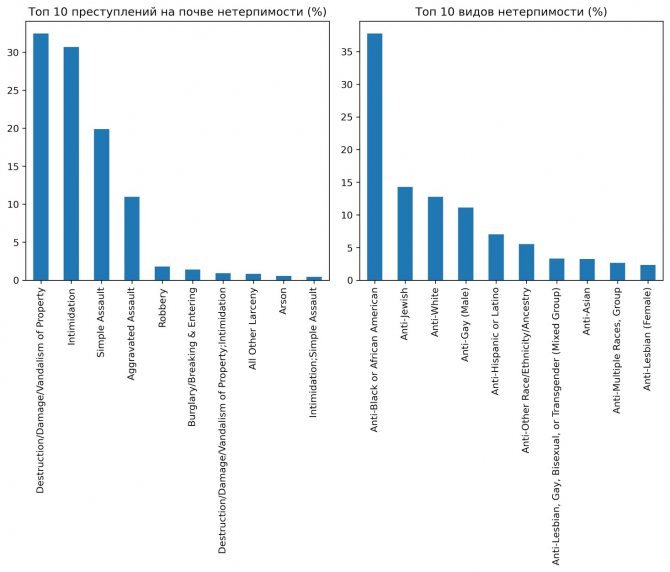
More than 200 thousand lines and a little more than 8 MB of memory. Let's first look at the top 10 crimes committed, types of intolerance (motives), races of criminals and categories of victims:
So what we see here:
- The most common type of crime is property damage/vandalism
, followed closely by
personal threat
(intimidation). Each of these types of crime accounts for almost a third of all cases. Then there are attacks, and robbery and other crimes are much less common. - intolerance towards blacks
leads by a wide margin (more than a third of all cases), then in descending order, but at approximately the same level: intolerance towards Jews, intolerance towards whites, intolerance towards gays. Other types of intolerance are statistically an order of magnitude less common than the leader. - 70% of all crimes are committed by whites
, about 23% by blacks, the rest “within the margin of error.” - Crimes against persons
account for 80% of all cases.
Just looking at these graphs, one can imagine that almost all crimes are whites threatening blacks with violence or damaging their property... But let's look at what crimes and types of intolerance are most typical for each racial category of criminals:
| OFFENSE_COUNT | TOP_OFFENSE | TOP_OFFENSE_SHARE | TOP_BIAS | TOP_BIAS_SHARE | TOP_VICTIM | TOP_VICTIM_SHARE | |
| OFFENDER_RACE | |||||||
| White | 79514 | Intimidation | 36.796036 | Anti-Black or African American | 46.877279 | Individual | 92.730840 |
| Black or African American | 25956 | Simple Assault | 36.292187 | Anti-White | 46.594236 | Individual | 94.760364 |
| Multiple | 4047 | Simple Assault | 36.545589 | Anti-Black or African American | 29.033852 | Individual | 91.153941 |
| Asian | 1453 | Simple Assault | 31.865107 | Anti-Black or African American | 30.075705 | Individual | 93.048864 |
| American Indian or Alaska Native | 1095 | Simple Assault | 40.182648 | Anti-White | 31.415525 | Individual | 93.059361 |
| Native Hawaiian or Other Pacific Islander | 35 | Simple Assault | 45.714286 | Anti-Other Religion | 22.857143 | Individual | 77.142857 |
In this table:
- OFFENSE_COUNT - the total number of crimes committed by representatives of this race
- TOP_OFFENSE - the most common type of crime for representatives of this race
- TOP_BIAS - the most common type of intolerance (motive for crime) for representatives of this race
- TOP_VICTIM - the most common category of victims for representatives of this race
For each typical category, the corresponding percentages of total crimes committed by members of that race are also presented.
Here you can see that for blacks and whites the main motive is racial intolerance towards members of the opposite race (47% of crimes for both races). At the same time, white criminals are mainly engaged in threats and intimidation
(37% of crimes), and blacks -
non-aggravated assaults
(36% of crimes). (It's amazing what a percentage match these two races show!) By the way, only for white criminals the main type of crime does not involve physical harm (threats); representatives of other races are more likely to commit attacks.
It can also be noted that Asians and representatives of mixed races (mestizo) also generally show hostility towards blacks, Indians and Eskimos - towards whites, but Hawaiians - towards “non-believers”. Well, these statistics have so far (for me personally) turned out to be quite expected.
Let's look at the number of crimes by year for each race of criminals:
As you might expect, the crimes of whites and blacks dominate the graph over the other races, which do not even show changes due to the difference in scale. The peak on the white side here falls on 1995 - 2002, and on the black side - the early 1990s. Since 2002, the number of crimes committed by whites motivated by intolerance has fallen quite steadily, having decreased by half compared to the peak in 2001; however, after 2016 it began to rise steeply again. Intolerance among blacks gradually declined from 1995 to 2004, but then began to rise just as smoothly, reaching the 1995 level in 2022.
It is interesting to note here that under Barack Obama (who, as we know, belongs to the African-American race), that is, from 2009 to 2017, the number of crimes among whites decreased very sharply, but at the same time the number of crimes among blacks showed a stable height. Earlier, under Bush (2001 - 2009), after a peak in crimes among whites in the first year of his presidency, the number of crimes committed by representatives of both races came to a “shelf” and remained virtually unchanged. But under Clinton (1993 - 2001), crimes among whites grew rapidly, almost year after year, while crimes among blacks, on the contrary, gradually decreased.
Well, let's look at the main trends. Let's now filter the data, leaving only the most necessary for further analysis.
First filtering: by type of crime and victims
In accordance with the research presented in my previous article, we will perform a similar filtering of data for analysis:
- among the categories of victims we will leave only individuals (we will exclude crimes against organizations, authorities and the whole society);
- Among the types of crimes, we will leave only murders, assaults (serious and ordinary), robberies and rapes as the most “villainous”.
Let's see what happened:
| YEAR | STATE_NAME | OFFENDER_RACE | OFFENSE_NAME | BIAS_DESC | COUNT | |
| 0 | 1991 | Arizona | Black or African American | Assault | Anti-Gay (Male) | 1 |
| 1 | 1991 | Arizona | Black or African American | Assault | Anti-White | 4 |
| 2 | 1991 | Arizona | White | Assault | Anti-Black or African American | 10 |
| 3 | 1991 | Arkansas | Black or African American | Assault | Anti-Black or African American | 1 |
| 4 | 1991 | Arkansas | Black or African American | Assault | Anti-White | 4 |
| … | … | … | … | … | … | … |
| 16428 | 2018 | Wisconsin | White | Assault | Anti-Hispanic or Latino | 1 |
| 16429 | 2018 | Wisconsin | White | Assault | Anti-Hispanic or Latino;Anti-White | 1 |
| 16430 | 2018 | Wisconsin | White | Assault | Anti-Physical Disability | 1 |
| 16431 | 2018 | Wisconsin | White | Assault | Anti-Sikh | 1 |
| 16432 | 2018 | Wisconsin | White | Assault | Anti-White | 1 |
16433 rows × 6 columns
Filtering and aggregating data made it possible to reduce the volume by 12 times without compromising factors important for analysis. New COUNT
at the end contains the number of crimes for a given year, state, race of offender, type of crime and motive.
As an intermediate step, let's look at the distribution of crimes by race of offenders:
and by type of intolerance:
So, white and black criminals together make up 93% of all cases (there are twice as many crimes among whites, but we know that there are 5 times more whites themselves). Therefore, it is not at all surprising that the proportion is almost the same by type of intolerance: 33% of crimes are motivated by intolerance towards blacks, 18% - intolerance towards whites. It is interesting to note here in passing that crimes motivated by intolerance towards whites are approximately equal in number to crimes motivated by intolerance towards homosexuals - this is the third largest motive.
Second filtering: by race of criminals and motive of crimes
The next logical step is to leave only black and white criminals and, accordingly, only “black and white” motives for crimes. By this we narrow the object of study to racism among whites and blacks. After additional filtering, our data array looks something like this:
| YEAR | STATE_NAME | OFFENDER_RACE | OFFENSE_NAME | BIAS_DESC | COUNT | |
| 0 | 1991 | Arizona | Black | Assault | Anti-White | 4 |
| 1 | 1991 | Arizona | White | Assault | Anti-Black | 10 |
| 2 | 1991 | Arkansas | Black | Assault | Anti-Black | 1 |
| 3 | 1991 | Arkansas | Black | Assault | Anti-White | 4 |
| 4 | 1991 | Arkansas | Black | Murder | Anti-White | 1 |
| … | … | … | … | … | … | … |
| 3870 | 2018 | West Virginia | White | Assault | Anti-White | 2 |
| 3871 | 2018 | Wisconsin | Black | Assault | Anti-Black | 1 |
| 3872 | 2018 | Wisconsin | Black | Assault | Anti-White | 4 |
| 3873 | 2018 | Wisconsin | White | Assault | Anti-Black | 6 |
| 3874 | 2018 | Wisconsin | White | Assault | Anti-White | 2 |
3875 rows × 6 columns
It's time to include specific indicators in the analysis (per population for each racial group). To do this, we will load population data from the file us_pop_1991-2018.csv.
Let's see how the US population is generally distributed by race (annual averages for 1991 - 2022):
There are 5.8 times more whites than blacks. All other races make up 11% of the population.
Next, we add population data to our dataset and calculate the specific number of crimes per 1 million representatives of each race.
Remembering that after the first filtering we were left with 4 types of crimes (murder, assault, robbery and rape), let's look at the distribution of these crimes for both races in absolute and specific indicators:
Separately for murders and rapes (since they are not visible on the general graphs):
What do we see here? And we see this:
- Of the types of crimes analyzed, assaults lead by a wide margin (25 times more than robbery, 250 times more than murder and rape).
- There are twice as many attacks committed by whites, but in specific terms blacks commit attacks almost 3 times more often.
- Robberies committed by blacks are 1.5 times more in absolute numbers and 10 times more in specific numbers.
- In total, whites committed slightly more murders than blacks, and about the same number of rapes. In specific terms, blacks are raped 6 times more often and killed 3.6 times more often than whites. Between murder and rape, whites “prefer” murder, and blacks prefer rape.
How homophobes attack women and what they lead to
Not only homosexual men suffer from aggression in St. Petersburg. In October 2014, at one of the St. Petersburg metro stations, a man attacked two girls with homophobic shouts because of their unisex clothing (the media also wrote that the girls showed their feelings for each other before the attack). Another passenger filmed the incident.
One of the girls was diagnosed with a broken nose, the other with damage to the temporomygomatic bone. The victims of the attack filed a complaint with the police, and six months later a criminal case was opened. However, the authorities interpreted the beatings as “domestic”; the motive of hatred was not taken into account.
Ksenia Kirichenko , coordinator of the LGBT organization “Coming Out”:
“The very fact of initiating a criminal case, of course, cannot but rejoice. However, we cannot agree with the classification of the attack committed. It is interpreted as everyday, while there are obvious signs pointing to a special motive for the actions of the violators - the motive of homophobic hatred.
As the girls’ lawyer, Ksenia Mikhailova, told Paper , the applicants themselves eventually refused to continue the case due to threats of violence.
Racist crimes by year
Let's see how the number of racist crimes committed by blacks and whites changed over the entire period:
It is not difficult to draw obvious conclusions from these graphs:
- On average, whites commit slightly more racist crimes per year, but 4-5 times less often in specific terms (in other words, an African-American is 4-5 times more likely to commit a racist crime than a white).
- However, since the 1990s, the specific rate of racist crimes among blacks has been gradually falling, having decreased by one and a half times over a quarter of a century.
- When moving from absolute indicators to specific indicators, the jumps in white crimes smoothed out significantly, which indicates a direct correlation between the number of crimes committed by whites and the size of the white population. However, this is not the case for blacks: large jumps remained in the unit plot, which indicates a poor relationship between racism among blacks and black population growth. Simply put, racism among whites has been relatively stable
(almost constant) since 1993, while racism among blacks is more likely
to be influenced by external factors
, such as socio-political and domestic events in the country.
Let's take a look at the generalized (average annual) indicators:
Once again we are convinced of the observations made: on average, whites commit 15-16% more crimes motivated by racism, but at the same time, due to the difference in the number of whites and blacks, as we know, it is almost 6 times, blacks are just as many times more likely commit such crimes.
Is it only whites against blacks, blacks against whites?
Let's add the intolerance parameter to our general indicators, i.e. motive for crimes. As you remember, as a result of filtering, we left only two motives: intolerance towards the white race and intolerance towards the black race. How are they distributed between white and black criminals? 100% polar, of course? But no!
Of course, there is polarization, but it turns out that there are crimes committed by blacks based on racial hostility towards their own people, and the same thing among whites. (I am sure that there are also crimes committed by homosexuals motivated by hatred of homosexuals, by women motivated by hatred of women, etc., because “man” sounds proudly complex; of course, you can check all this for yourself!)
But what is curious here: the share of crimes committed by blacks motivated by hatred towards their own people is 11% of all crimes committed by blacks, and for whites this figure is 9%. That is, a black person has a slightly higher chance of turning against his own people.
Geography of crimes
Finally, let's look at the distribution of racist crime across US states.
To calculate specific indicators, as usual, we will need to load the numbers by state and race from the us_pop_states_race_2010-2019.csv file. Average annual numbers of whites and blacks by state:
OK, nothing new: overpopulated California, Texas, Florida and New York, where, as you could see from the last article, quantitatively more crimes are committed.
But is the share of the black population the same everywhere - the notorious 13%? Let's see:
So, more than half of the entire District of Columbia is black (where the glorious city of the Pentagon Washington is located), about a third in the cotton southern states - Mississippi, Louisiana, Georgia, Alabama, South Carolina and in one northern one (Maryland, where the District of Columbia, where the glorious city is...) ; the rest have less than a quarter. That being said, this is just for reference.
What about crimes? Let's look at the average annual indicators in absolute and specific terms:
It can be seen that the most populous state, California, leads in the absolute number of crimes. But then Florida and Texas were squeezed out by Michigan, Illinois and Maryland, the economically more developed northern states. And on the specific chart, the least populated states came out ahead - Montana, Vermont, Idaho, North and South Dakota, Alaska (all also in the north of the country). It is clear that the proportion of crimes between whites and blacks is not the same across states, despite the dominance of blacks in terms of specific indicators (for example, the District of Columbia and Hawaii stand out on the “white” side).
We will display it on the map (for greater clarity, we will replace the average annual indicators with the accumulated amount).
First in absolute terms:
The Northeast of the country (especially Michigan) plus California and Washington on the Pacific coast stand out here. And in specific terms:
There is a noticeable predominance of the north with the least populated states: the District of Columbia, both Dakotas and the same Washington, as well as a couple of states on the eastern and western sides. At the same time, the southern states do not show significant crime among the population.
In general, if you are asking the question “Where will I see more racially motivated crimes?”, look at the first map. If your question is “Where is each person more likely to commit a racist crime?” - see the second card. I will not draw any other conclusions regarding distribution.
Execution of a Tajik and a Dagestani
In August 2007, a terrifying video entitled “Execution of a Tajik and a Dagestani” appeared on the RuNet. The video captured the brutal murder of two young people, natives of Dagestan and Tajikistan: in the first frames, a frightened young man lay tied up on the floor, face down, with a red flag with a swastika visible on the wall. Then a masked man approached the young man, grabbed the victim by the hair and began sawing off the unfortunate victim’s head. The killer then tried to put his head on the dead man's back, but it rolled off, and in the end he put his head on the floor facing the camera. The second scene shows another young man kneeling near a hole as an unknown person shoots him in the back of the head with a pistol.
Instead of conclusions
How is it going with Bulgakov?
“Facts are the most stubborn things in the world.” If we are told something from all sides, it is not necessarily true - it may turn out to be a half-truth or a lie. But having facts in your hands in the form of N number of data sets, you can confirm or refute certain arguments yourself. You can build hypotheses and confirm/refute them using statistical methods, or you can simply examine the data without any hypotheses and find certain patterns in them, which in turn will help either draw conclusions or propose hypotheses that can then be “dissected.” It's up to you to decide whether to take your word for it or check it out. Of course, this little analysis is far from complete. It is done superficially, because I only looked at the basic indicators, without using even a quarter of the available apparatus of mathematical statistics. Of course, one can argue about the quality of the source data. Can all recorded data be trusted? Are all crimes recorded? Who determines the motives for intolerance and how? But as for me, I would rather analyze official open data as-is than be content with statements like “a toxic substance X was found in the blood of Mr. N” or “country W has been systematically violating human rights for decades.”
PS
In the comments to my previous research, I was asked many times to distinguish between “pure whites” and “Latinos”, since cultures do have differences. I would not be against it, but, unfortunately, this cannot be done in either case due to the paucity of information about this ethnic characteristic in the source data. For example, in the data we analyze in this article, of the 79,514 crimes committed by whites, only 6,999 are labeled as ethnic, with only 489 labeled as “Hispanic or Latino” (that's 0.6%). Of course, such data cannot be used for analysis.
How an LGBT activist lost sight in one eye and reached the ECHR
In June 2013, more people than usual came to the Rainbow Tea Party at the office of the LaSky LGBT project due to the March Against Hate that had taken place the day before. For the sake of “newcomers,” access to the usually closed event was made open to the public. Activist Dmitry Chizhevsky quickly got bored with the tea party, and after an hour he decided to leave.
In the corridor, Chizhevsky met a young man and a girl. According to Chizhevsky’s recollections, they looked either like neo-Nazis or football fans and tried to hide their faces behind scarves and hoods. Before Chizhevsky understood anything, an air pistol was pointed at his eye and shot.
Dmitry Chizhevsky , activist, from an interview with Russian Planet:
“I felt a blow to my eye, then I heard a shot. There the corridor ends in a room, I turned the corner so as not to get hit by other bullets. Apparently, one of them ran after me, beat me, shouted: “Where did you run, *******?!” They say that they had a bat in their hands, but I no longer saw anything: I lay there and tried to close my eyes. Then people started running out from another room. The attackers apparently got scared and ran away on their own. That's all I remember.
After the attack on LaSky, Chizhevsky sees with only one eye. A case was opened under the article of hooliganism, but in 2015 it was suspended due to failure to identify the accused. Chizhevsky filed a complaint with the ECHR, which stated that “the motive for hatred of LGBT people was virtually obvious to the national authorities” and the authorities’ reluctance to investigate crimes against LGBT people speaks of their “official acceptance and connivance.” In August 2022, the ECHR accepted the complaint.


